Use APKPure App
Get Linux GProf (Profiler) Manual old version APK for Android
Linux gprof (Profiler) Handbuch
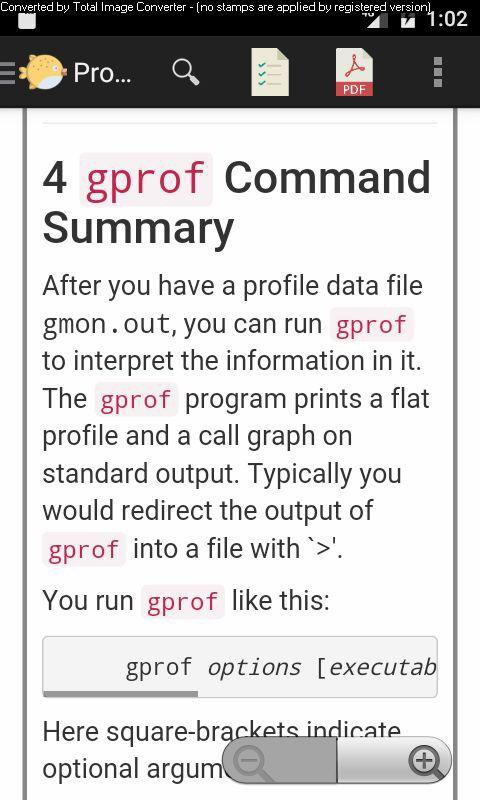
Profiling allows you to learn where your program spent its time and which functions called which other functions while it was executing. This information can show you which pieces of your program are slower than you expected, and might be candidates for rewriting to make your program execute faster. It can also tell you which functions are being called more or less often than you expected. This may help you spot bugs that had otherwise been unnoticed.
Since the profiler uses information collected during the actual execution of your program, it can be used on programs that are too large or too complex to analyze by reading the source. However, how your program is run will affect the information that shows up in the profile data. If you don't use some feature of your program while it is being profiled, no profile information will be generated for that feature.
The GProf Profiler Reference Manual provides beginners with a simple introduction to the basics, and experts will find advanced details they need.
In this you will see the following things below.
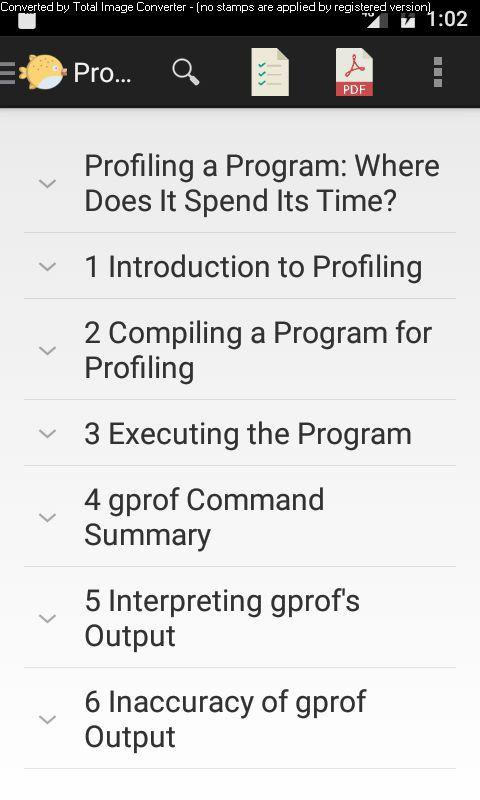
Table of Contents
1 Introduction to Profiling
2 Compiling a Program for Profiling
3 Executing the Program
4 gprof Command Summary
4.1 Output Options
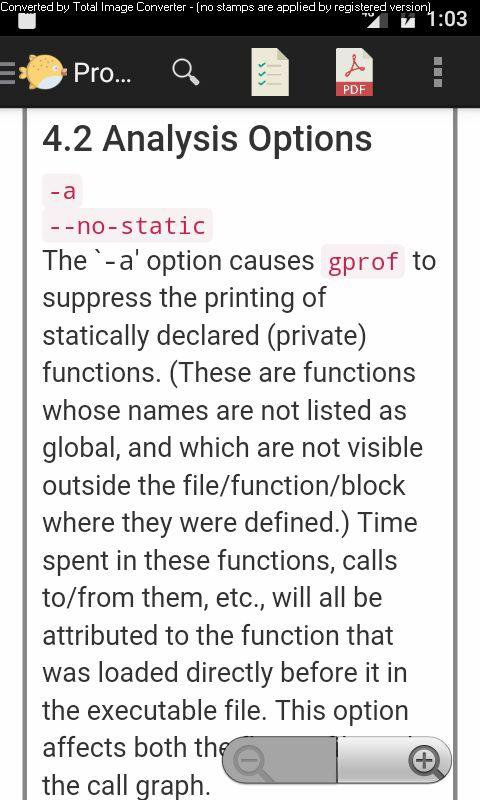
4.2 Analysis Options
4.3 Miscellaneous Options
4.4 Deprecated Options
4.5 Symspecs
5 Interpreting gprof's Output
5.1 The Flat Profile
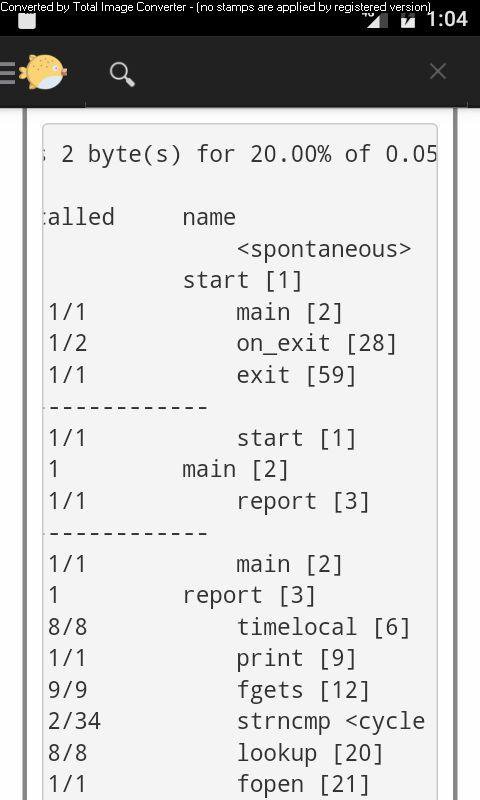
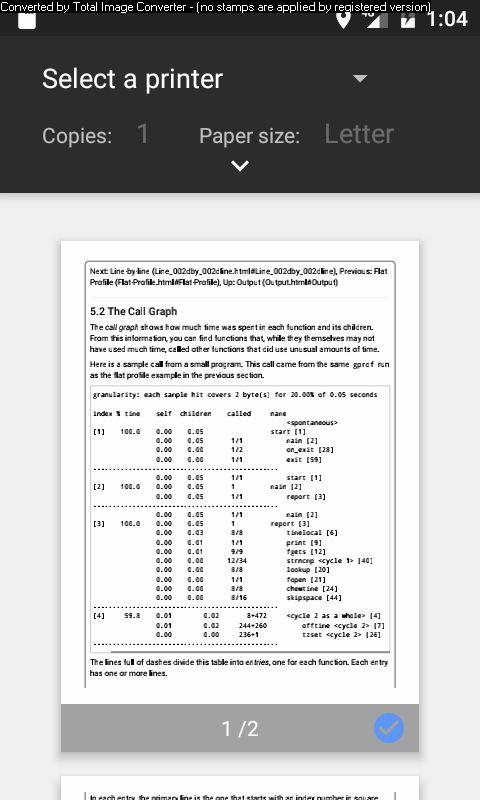
5.2 The Call Graph
5.2.1 The Primary Line
5.2.2 Lines for a Function's Callers
5.2.3 Lines for a Function's Subroutines
5.2.4 How Mutually Recursive Functions Are Described
5.3 Line-by-line Profiling
5.4 The Annotated Source Listing
6 Inaccuracy of gprof Output
6.1 Statistical Sampling Error
6.2 Estimating children Times
7 Answers to Common Questions
8 Incompatibilities with Unix gprof
9 Details of Profiling
9.1 Implementation of Profiling
9.2 Profiling Data File Format
9.2.1 Histogram Records
9.2.2 Call-Graph Records
9.2.3 Basic-Block Execution Count Records
9.3 gprof's Internal Operation
9.4 Debugging gprof
You will find all this section offline without any internet connection and learn GProf easily anywhere and anytime.
Last updated on Jan 25, 2018
Initial Release
Aktuelle Version
![]() 1.0
1.0
Von hochgeladen
Khandaker Mohammad Farid
Erforderliche Android-Version
Android 2.3.2+
Kategorie
Bericht


Discover what you want easier, faster and safer.

 Ref")
Linux GProf (Profiler) Manual
1.0 by Zdiv
Jan 25, 2018