在APKPure安全快速地下载APK
APKPure 使用签名验证功能,确保为您提供无病毒的 Solar-Log® APP APK 下载。
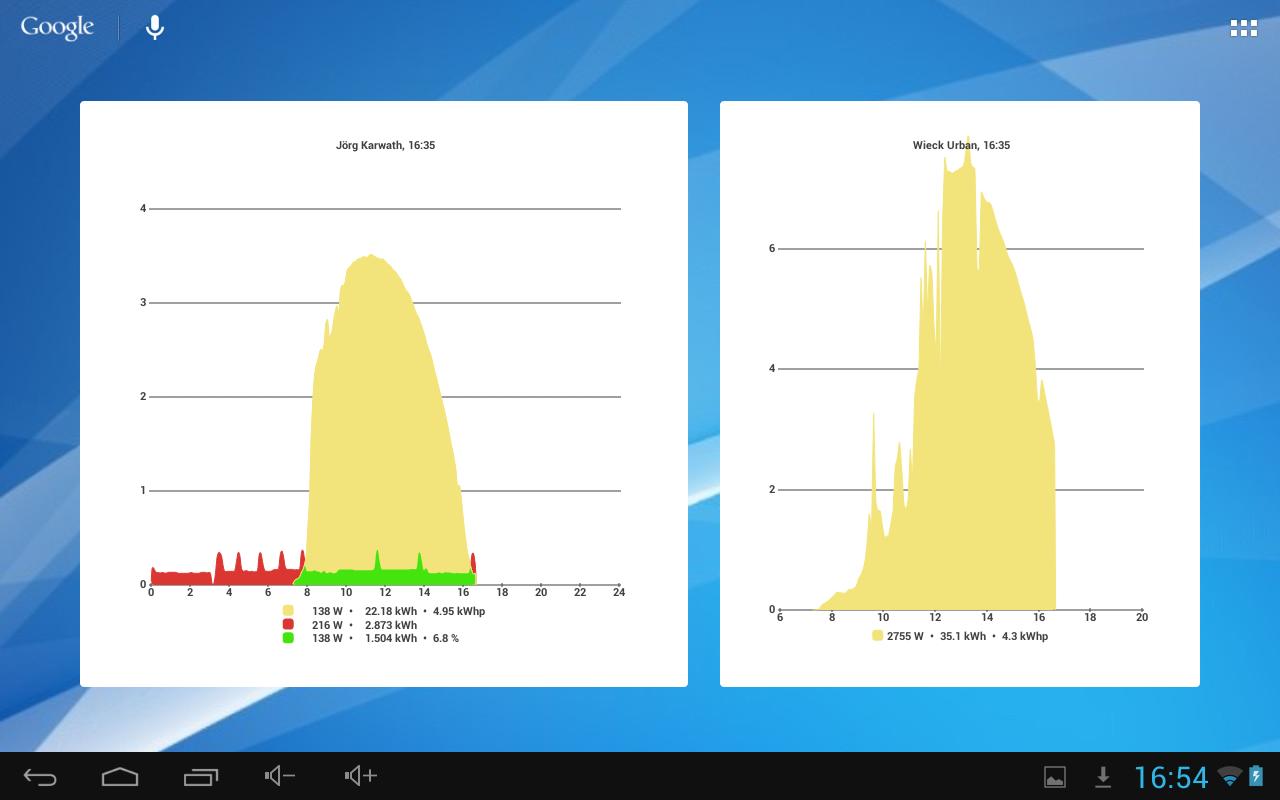
太阳能Log®应用程序从一个光伏电站的可视化数据的产量。
The Solar-Log® App visualizes the yield data from a photovoltaic plant. The data is concisely displayed as a daily, monthly, yearly or total overview and can be compared with the target yields.
This allows a photovoltaic plant to be monitored and checked at a glance. In addition to the yield data, CO² savings and power consumption, when available, can also be visualized. With the Slideshow, the App is always active and rotates between different views. Plant Management allows users to switch between several plants. The size of the plant and the installed inverters do make any difference there. All plants that are connected to Solar-Log® WEB "Commercial Edition" and Solar-Log® WEB "Classic 2nd Edition" are monitored.
At the beginning, two demo PV plants are available as a reference with live data. These plants offer an insightful view of the performance of modern plants.
Available languages:
DE, EN, TR, GR, NL, PL, ES, FR, IT, DK
NEW IN THIS VERSION
- new user interface, modern design
- 2nd Widget
Two different plants can now be set up as widgets. Two widgets are then added to the home screen. With a
tab, a particular widget is accessed and a plant selected. After closing the app, the widget is to the last
selected plant.
- sub-consumers
- new languages available: Turkish, Greek, Dutch, Polish
- improved translations: Spanish, French, Italian, Danish
Version 1.0.4
-------------------
- Bugfix: Not all inverters were recognized on some plants. Fixed!
Version 1.0.3
-------------------
- Bugfix: On some devices newly added plants were not saved. Fixed.


感谢您的评分和反馈!
您已经评分了。