APKPure で安全で高速な APK のダウンロード
APKPure は署名検証を使用して、ウイルスフリーの Lean Run Chart APK ダウンロードを保証します。
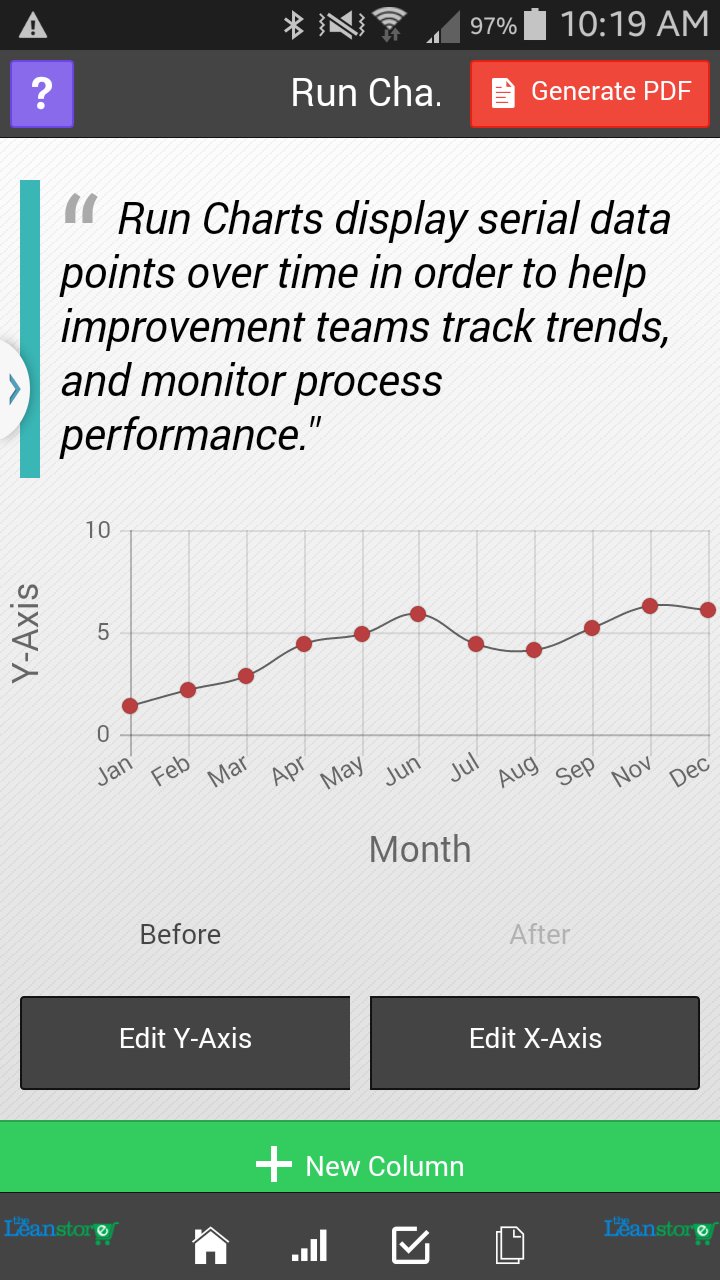
学ぶ&時間をかけてデータポイントを表示&レポートを生成するために実行してチャートを使用します。
Learn the basics on how the Run Chart is used to display data points over time. The visual representation of data allows for seeing trends and patterns of an entire process over time. This app is designed for anyone who wants to effectively visualize data trends and patterns in analyzing processes in a continuous improvement or problem solving project. Associates, Managers, and Executives with either some or no experience with Lean will benefit from this app.
Content Includes:
- Multi-functional content covering what a Run Chart is and how it can be effective in verifying results (process changes) in continuous improvement projects
- Simple, effective steps and examples of Run Charts
- The ability to create Before and After Run Charts, output it as a pdf or png file, and have access to previous Run Charts
- Conduct and customize a Run Chart assessment on your device
- Record, assign, and track Action Items
- Access to the Assessment file in Excel for customization
- A Lean Sigma puzzle to keep your mind active
Look for more apps in our Quality Improvement Tools Series.


あなたの評価とフィードバックをありがとう!
すでに評価しました。