APKPure에서 안전하고 빠른 APK 다운로드
APKPure는 바이러스 없는 Confidence Interval Calculator APK 다운로드를 위해 서명 확인을 사용합니다.
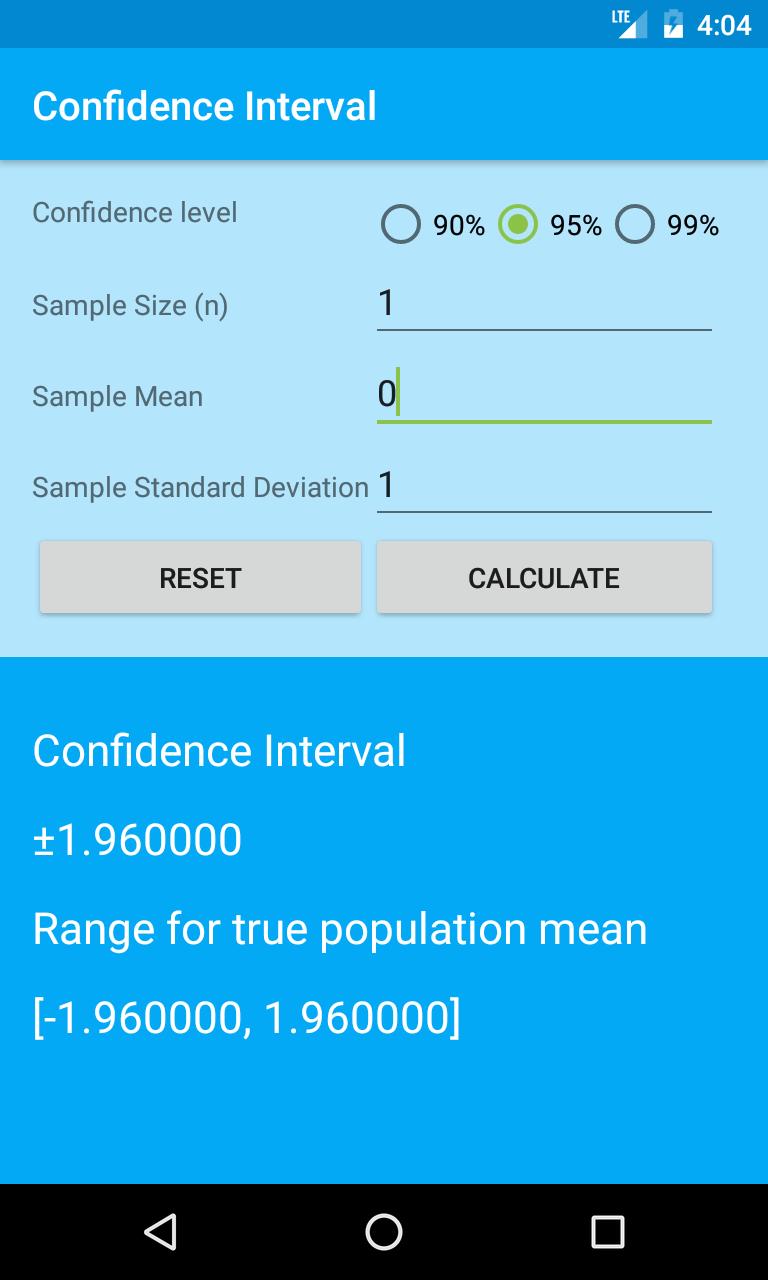
수단 및 샘플 비율에 대한 신속 계산기 신뢰 구간.
Quickly calculator confidence intervals for means and sample proportions.
About confidence intervals
In statistics, a confidence interval (CI) is a type of interval estimate of a population parameter. It is an observed interval (i.e., it is calculated from the observations), in principle different from sample to sample, that frequently includes the value of an unobservable parameter of interest if the experiment is repeated. How frequently the observed interval contains the parameter is determined by the confidence level or confidence coefficient. More specifically, the meaning of the term "confidence level" is that, if CI are constructed across many separate data analyses of replicated experiments, the proportion of such intervals that contain the true value of the parameter will match the given confidence level. Whereas two-sided confidence limits form a confidence interval, their one-sided counterparts are referred to as lower/upper confidence bounds (or limits).
Confidence intervals consist of a range of values (interval) that act as good estimates of the unknown population parameter. However, the interval computed from a particular sample does not necessarily include the true value of the parameter. When we say, "we are 99% confident that the true value of the parameter is in our confidence interval", we express that 99% of the hypothetically observed confidence intervals will hold the true value of the parameter. After any particular sample is taken, the population parameter is either in the interval, realized or not; it is not a matter of chance. The desired level of confidence is set by the researcher (not determined by data). If a corresponding hypothesis test is performed, the confidence level is the complement of the level of significance, i.e. a 95% confidence interval reflects a significance level of 0.05. The confidence interval contains the parameter values that, when tested, should not be rejected with the same sample. Confidence intervals of difference parameters not containing 0 imply that there is a statistically significant difference between the populations.
In applied practice, confidence intervals are typically stated at the 95% confidence level. However, when presented graphically, confidence intervals can be shown at several confidence levels, for example 90%, 95% and 99%.
Certain factors may affect the confidence interval size including size of sample, level of confidence, and population variability. A larger sample size normally will lead to a better estimate of the population parameter.
Confidence intervals were introduced to statistics by Jerzy Neyman in a paper published in 1937.


등급과 피드백에 감사드립니다!
당신은 이미 평가했습니다.