Use APKPure App
Get Gantt chart guide old version APK for Android
Present your data in Gantt chart templates by checking out our Gantt chart guide
Present your data in Gantt chart templates by checking out our Gantt chart guide
What is a Gantt chart template? Learn Gantt chart guide
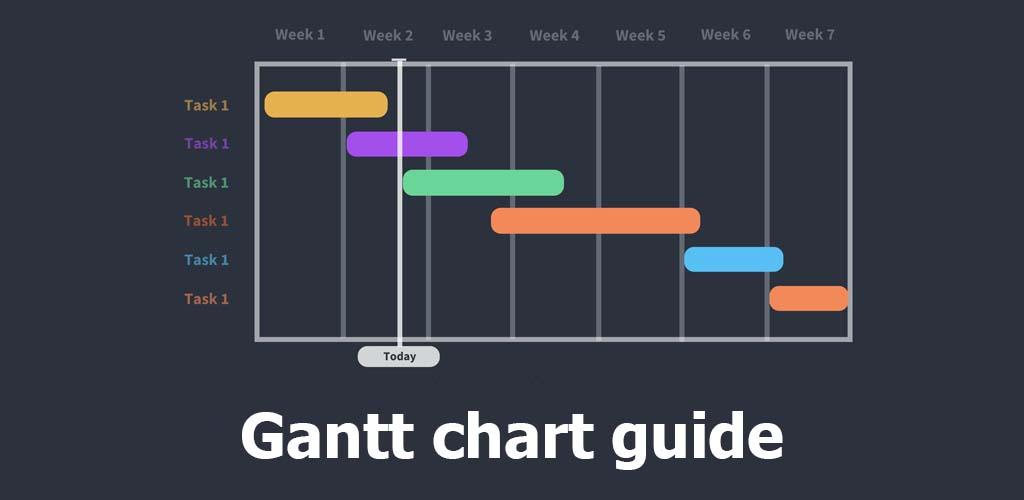
A Gantt chart template graphically represents all the tasks and deliverables in an ongoing project. Gantt chart templates, each task is displayed as a horizontal bar and where it starts represents the start date of that specific task. The length of the bar then shows how long you should complete the task.
With each task stretched and stacked along your timeline, you can easily determine your team's progress, how much work is left, and the current status of the project. Gantt chart templates, this helps keep every team member on the same page and helps you set realistic goals for future project planning.
It's also a great way to ensure no overlap occurs! Ideally, your tasks should be staggered in a regression-like fashion in your project timeline, but if you notice an almost vertical stack of bars over the same time period, it's time to work out some due dates.
Dive into everything you need to know about Gantt charts, including how to use them, their limitations, and the qualities that make them special.
how to use:
Ready templates in Excel
Draw links showing dependencies between tasks from gantt chart in exsl.
- View the main page for tasks and links.
Project files can be shared to the cloud.
Project Schedule, Project, brings tasks to your Android phone or tablet. Gantt Chart in Excel Use retail application, Gantt chart templates, import business projects, or schedule ready-made tasks for your daily life.
Simple Gantt chart with Gantt chart guide
How to create a Gantt chart in Excel
Managing projects without Gantt charts is like trying to find something in a loaded suitcase. You may still find what you're looking for, but not without spending a reasonable amount of time sifting through the clutter first.
Five major components of Microsoft Excel, what would they be? It seems to find an alternative to digital data all over the world.
It is not an Excel chart. And by the looks of it, one type of chart is opaque to many - the Gantt chart. This short Gantt chart tutorial and master class explains how to create a simple Gantt chart in Excel files New Product Chart New Product Chart New Project Chart New Project Chart, Gantt Chart Templates.
What is a Gantt chart?
The Gantt chart is named after Henry Templates Gantt charts, an American mechanical engineer and management consultant who invented the Gantt chart in the early 2000s. Project Gantt Chart in Excel Projects or tasks in the form of horizontal bar charts. The Gantt chart shows the structure
How to create a Gantt chart in Excel
Unfortunately, the Gantt chart table comes with an option. Quick Gantt chart symbol in bar graph.
Please follow these steps: The Gantt chart is in Excel 2010, but you can use similar charts in some versions of Excel.
1. Create a project schedule
You start by visualizing your project data in an Excel spreadsheet. Make a list of suitable projects to start the tasks.
2. Based on a bar chart
You begin creating your own Gantt chart in Excel by setting up a regular stacked bar chart.
● Define the startup range with the column header, which is B1:B11 in our case. Make sure that only cells containing data are selected
The column does not spy.
● Switch to the first tab > Set times bar.
● Gantt chart templates
3. Add the graph data to the graph
Now you need to add another series to the Gantt chart in Excel for it to be.
● Right-click anywhere inside to locate the selected data from the data list.
Open the Select Data Source window. The start date has already been added in the screenshot below. And you need to add "duration" in there as well.
● Click the Add button to select more data ( ) that you want to plot in the Gantt chart. Gantt charts are very popular and visual charts
Top 16 Gantt Chart Templates
The methodology used to view your tasks against the time allotted to complete them.
Last updated on Jan 18, 2023
Minor bug fixes and improvements. Install or update to the newest version to check it out!
Latest Version
![]() 1
1
Uploaded by
Bobby Lynch
Requires Android
Android 5.0+
Available on
![]()
Category
Report


Discover what you want easier, faster and safer.

Gantt chart guide
1 by 4U Mix
Jan 18, 2023