Package Name:com.appbolt.histogrammaker
Show More

Histogram Maker for creating, customizing, and exporting bar distribution charts
Histogram Maker is a focused data visualization tool that lets you build frequency distribution charts on your phone. Whether you are a student completing a statistics assignment, a teacher preparing classroom material, or an analyst reviewing numerical trends, this histogram maker provides a simple workspace to turn raw numbers into readable bar charts.
All data processing happens locally on your device. No internet connection is required to create or view charts.
Data Entry
You can input data manually using a structured table with category and value columns. Tap the add button to insert new rows, or remove entries you no longer need. For larger datasets, import numbers directly from CSV files stored on your device. The app also includes sample datasets such as monthly sales figures and student test scores so you can start using the histogram maker immediately.
Chart Customization
Adjust the chart title, X-axis label, and Y-axis label to match your data context. Toggle gridlines on or off depending on your preference. Choose from multiple bar color options including solid and gradient styles to change how the histogram chart appears.
Statistical Summary
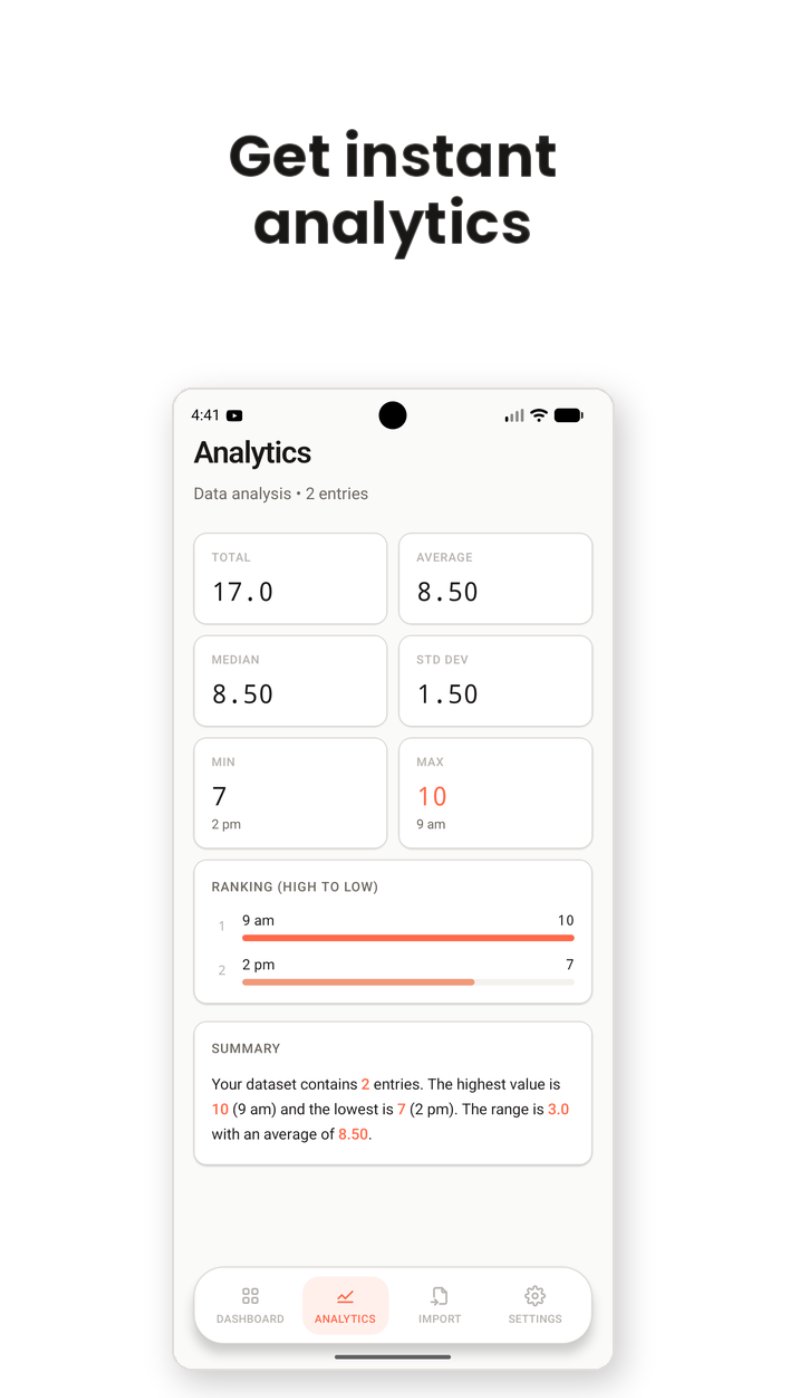
The histogram maker automatically calculates key statistics from your active dataset. View the total number of entries, arithmetic mean, median, standard deviation, minimum value, maximum value, and range. A ranked list shows each category sorted from highest to lowest value, with visual indicators showing relative proportions.
Export and Share
Save your completed histogram chart as a PNG image to your device gallery. Share the chart image directly to other apps using the standard system share menu. This makes it straightforward to include your bar charts in reports, presentations, or class submissions.
How to use Histogram Maker:
1. Open the app and enter your data values or import a CSV file.
2. Set the chart title, axis labels, and preferred bar colors.
3. Review the calculated statistics on the analytics screen.
4. Export the histogram chart image or share it with another app.
Who this app is for:
Students working on statistics, probability, or data science coursework. Teachers and professors who need quick visual aids for lectures. Researchers and analysts who want a portable tool for plotting frequency distributions. Anyone who needs to convert a list of numbers into a clean bar chart without using desktop software.
Data handling:
Histogram Maker does not transmit your CSV files or entered data to any server. All chart rendering and statistical calculations run entirely on your device. The app uses local storage to save your work between sessions.





One-click to install XAPK/APK files on Android!

Thanks for your rating and feedback!
You have already rated.